Gravity
Gravity is commonly used in multiple environmental, geological and civil projects to try and infer/ detect any geological structures or voids in the subsurface. By interpreting the gravity datasets the engineers/ geophysicists can determine which areas may be of high risk which will aid environmental and infrastructural risk assessments in areas prone to infrastructural damage. You can measure and interpret gravitational data by initially considering the gravitational acceleration.
The rate of acceleration (g) of an object is proportional to its mass and therefore density (i.e., g = m = d), we can interpret subsurface variations and measure bulk density contrasts in the lithostratigraphy (i.e., by measuring gravitational variation over an area)
If there is a significant contrast with the host rock a gravity anomaly will be present. These can be both negative (i.e., mass deficit and -ve free air anomaly) and positive (i.e., excess mass and +ve free air anomaly). For example, large negative anomalies which propagate outwards/from an area are due to air pockets/ voids, usually formed due to historic mining in Karstic environments. Conversely, positive anomalies are rare and commonly caused by dense material, an example of this would be a mafic intrusion (i.e., Ferrous Dyke) into a sedimentary host rock (Fig. 1).
When you consider the spatial extent of the anomaly along with the frequency type, the shape, size and depth can be derived by calculating the Bouguer anomaly (i.e. relates slab thickness to elevation) from the raw gravity results (Fig. 2).
In order to measure Gravity, we can use both absolute and relative gravity measurements which can be obtained using active and passive collection methods.
Active
In large scale projects the absolute gravity measurements are obtained using the weight drop/pendulum (i.e. calculate gravitational acceleration from the velocity and distance from (t=0) to (t=1)) active methods.
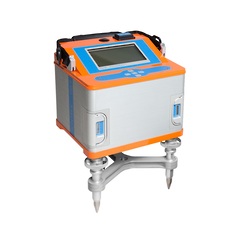
Sintrex Gravimeter (CG6) – Passive
Whereas in localised and shallow subsurface investigations passive static gravimetric methods are used (i.e. deal with (g) and the sum of the vertical component of (g)). In order to derive the relative gravity reading the change in (g) is equal to the change in the internal spring length/how much the spring deforms under gravity over time (i.e. measured to the nearest 0.1ga (1 part of 10^6) at different “stations” across an area.

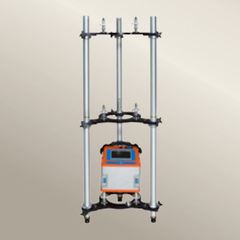
In terms of the survey design, the surveys are conducted in a uniform xy grid format whereby the transect spacing is less than the estimated depth to the body (Fig. 5). A number of checks should be undertaken before the data can be collected. For example, to obtain accurate results the gravimeter (CG6) must be placed on relatively level ground in a quiet and open area (i.e., not on steep gradients, densely urbanised and noisy environments).