Gradient Calculator
The program simulates the magnetic response from a total field gradiometer over a target defined by preset values or customized by the user. Its purpose is to graphically display the recorded magnetic response from a buried target, considering various gradiometer separations, survey speeds, and sampling separations. The visualizations include graphs showing the magnetic response from two total field sensors and the transverse or vertical gradient, as well as side and plan views of the survey geometry. These views feature vector arrows indicating the field direction or an amplitude color chart. A table of model values is also provided, displaying useful calculations made by the program.
This program includes two wizards to guide users through its features and functions. The simple wizard uses predefined targets and basic survey options to quickly generate results for standard surveys, while the advanced wizard offers more complex options and greater detail on individual input fields. It also walks users through the process of defining custom targets. Upon completion of the wizards, the results are displayed in the main program, providing access to all adjustable parameters. Users can also choose to skip the wizards and proceed directly to the main program if desired.
Select A Program
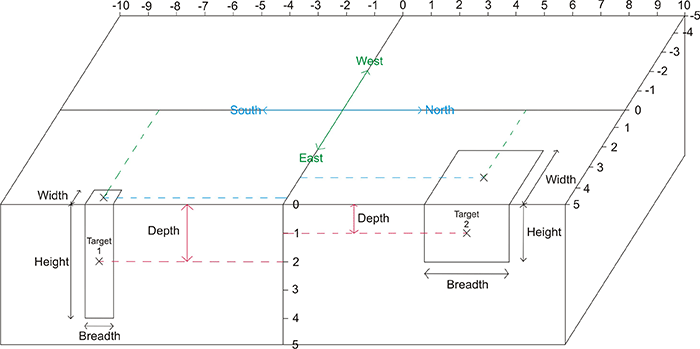
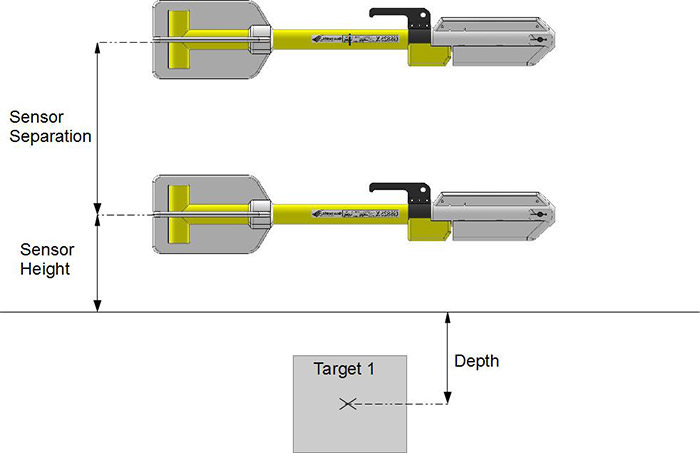
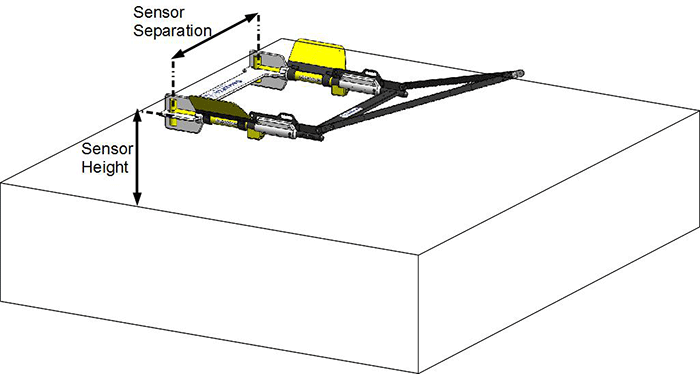
Survey Geometry
Change View
Model Display
Smoothing Contours may take a minute to calculate.
Model Values
| Gradient Maximum Peak | |
|---|---|
| Gradient Maximum Trough | |
| Sensor 1 Maximum Peak | |
| Sensor 1 Maximum Trough | |
| Sensor 2 Maximum Peak | |
| Sensor 2 Maximum Trough | |
| Instrument Noise | |
| Survey Noise | |
| Regional Field | |
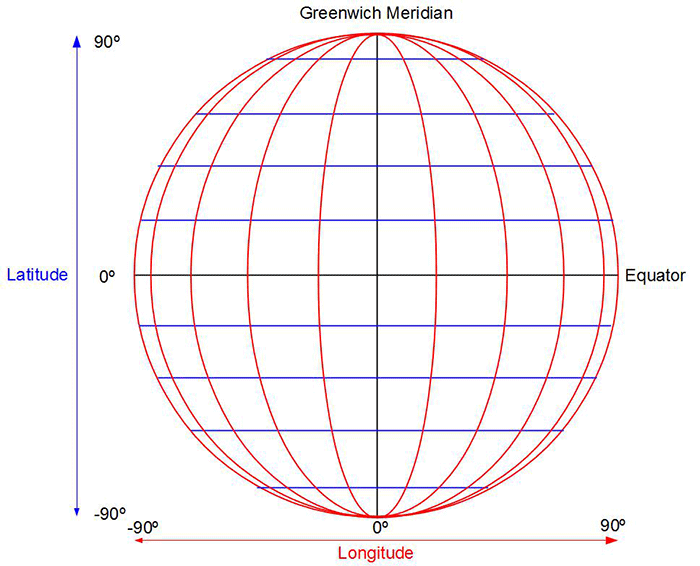
| Inclination of Field | |
| Declination of Field |